


Understanding Bitcoin price movements starts with recognizing that its value is driven mainly by supply and demand dynamics in the market. Price changes occur due to factors like investor sentiment, market trends, regulatory news, and overall adoption rates. These elements interact to create fluctuations in Bitcoin’s price over time.
The decentralized nature of Bitcoin means no single entity controls its price, making its movements sometimes unpredictable but still influenced by measurable economic and social factors. Monitoring trading volumes and external events can offer insights into why prices rise or fall.
By breaking down these fundamental drivers, anyone can gain a clearer picture of Bitcoin’s price behavior. This knowledge helps in making informed decisions rather than relying on speculation or hype.
What Influences Bitcoin Price Movements
Bitcoin prices fluctuate due to a combination of factors related to availability, market activity, and public perception. These elements interact continuously, creating shifts in price that reflect both fundamental and speculative forces.
Supply and Demand Dynamics
Bitcoin’s supply is capped at 21 million coins, creating a scarcity that directly drives its value. New bitcoins enter circulation through mining rewards, which reduce over time in events called “halvings.” This decreasing supply, paired with consistent or rising demand, tends to push prices up.
Demand varies with investor interest, adoption for transactions, and institutional involvement. Large purchases or sales by significant holders, sometimes called whales, can cause rapid price changes. Additionally, changes in adoption rates among businesses and individuals influence demand steadily.
Market Liquidity
Liquidity measures how easily bitcoin can be bought or sold without altering its price. Higher liquidity usually leads to more stable prices. Exchanges with larger trading volumes provide better liquidity, reducing price swings from single trades.
In contrast, low liquidity markets are prone to sudden price spikes or drops. During events like regulatory announcements or market stress, liquidity can dry up quickly, causing more significant price volatility. Market depth charts help traders assess liquidity by showing bid and ask volumes at different price levels.
Investor Sentiment
Investor sentiment reflects the collective mood and expectations about Bitcoin’s future. Positive news, such as increased adoption or favorable regulation, can boost confidence and prices. Negative events, scandals, or regulatory crackdowns can lead to fear, triggering sell-offs.
Sentiment is often tracked using indicators like the Fear & Greed Index or social media analysis. These tools measure emotional trends that influence buying and selling behavior, sometimes ahead of fundamental shifts. Sudden changes in sentiment can create sharp price movements, independent of supply and demand fundamentals.
The Role of Market Participants
Bitcoin price movements are shaped significantly by different types of market participants. Each group acts based on distinct motivations and strategies, influencing liquidity, volatility, and overall market sentiment.
Retail Investors
Retail investors are individual traders and buyers who participate on a smaller scale. They often react to news, social media trends, and price speculation, which can lead to sudden spikes or drops in volume. Their activity is typically driven by short- to medium-term gains rather than long-term holding.
Retail investors use popular platforms like Coinbase or Binance for trading. Their collective actions add liquidity but can also cause unpredictable volatility, especially during market hype or panic. Many retail traders lack access to advanced market tools, causing them to follow herd behavior more frequently.
Institutional Investors
Institutional investors include hedge funds, asset managers, and corporations that allocate significant capital to Bitcoin. Their entry often reflects confidence in Bitcoin as a long-term store of value or portfolio diversification strategy. These investors execute large trades, which can stabilize or disrupt the market depending on the context.
Institutions tend to use sophisticated analytics and tend to operate on longer time horizons. Their participation often encourages regulatory clarity and market maturity. Because they move large amounts of capital, their buying or selling can signal strong future price trends.
Whales and Large Holders
Whales are individuals or entities holding massive amounts of Bitcoin, frequently over thousands of coins. Due to their holdings, their trades have an outsized impact on Bitcoin’s price and liquidity. Their behavior can trigger price swings through large buy or sell orders.
Whales sometimes engage in strategic trades to influence market sentiment or test liquidity levels. Tracking whale movements via on-chain analysis helps anticipate potential price shifts. However, not all whale activity is manipulative; some hold bitcoins for long-term gains and rarely trade.
External Factors Impacting Bitcoin Price
Bitcoin’s price is influenced by a variety of external forces beyond its own market activity. These include shifts in the global economy, changes in legal frameworks, and advances in technology.
Macroeconomic Events
Macroeconomic factors like inflation rates, interest rates, and currency fluctuations directly affect Bitcoin’s appeal as an asset. For example, when inflation rises, Bitcoin is often seen as a hedge because it is deflationary by design.
Economic crises or stock market downturns can drive investors toward Bitcoin, increasing demand and pushing prices higher. Conversely, strong traditional market performance may reduce Bitcoin’s attractiveness. Global events impacting major currencies, such as the US dollar’s strength, also influence Bitcoin’s price due to its common trading pairs.
Government Regulations
Regulatory decisions affect Bitcoin’s price by altering market access and investor confidence. Announcements of bans or restrictions on cryptocurrency trading tend to cause price drops.
Conversely, legalization and clear regulatory frameworks can boost adoption and investment sentiment. Key factors include tax policies, anti-money laundering regulations, and securities classifications. Different countries’ stances on Bitcoin—ranging from acceptance to prohibition—create varying impacts on global price movement.
Technological Developments
Improvements in blockchain technology, such as scaling solutions or security enhancements, can increase Bitcoin’s usability and trustworthiness. For instance, the implementation of the Lightning Network aims to reduce transaction costs and times, making Bitcoin more practical for everyday use.
Security breaches or technical failures, on the other hand, harm confidence and may cause price declines. Developments in related technologies, like broader adoption of digital wallets and exchange platforms, also shape Bitcoin’s price trajectory by affecting accessibility and liquidity.
Understanding Price Charts and Patterns
Price charts visually represent Bitcoin’s market activity, revealing trends and potential turning points. Identifying key formations and levels can help interpret buyers’ and sellers’ behavior.
Candlestick Analysis
Candlestick charts display price movements within a set time frame using “candles” composed of a body and wicks. The body shows the opening and closing prices, while the wicks indicate highs and lows. A green or white body means the price closed higher than it opened; red or black means it closed lower.
Patterns like Doji, Hammer, and Engulfing signal potential reversals or continuations. For example, a Hammer after a downtrend often suggests a bullish reversal. Recognizing these shapes helps predict short-term price action.
Candlesticks reveal market sentiment by showing where buyers and sellers dominate during a period.
Support and Resistance Levels
Support is a price level where buying interest tends to prevent further declines. Resistance is where selling pressure limits upside movement. These levels are formed by past price reactions and psychological thresholds.
Traders watch these zones to anticipate price bounces or breakouts. If Bitcoin nears support, buyers may step in; near resistance, sellers might increase.
Repeated testing of these levels without breaking indicates their strength. Once broken, old resistance can turn into new support, or vice versa.
Volume Trends
Volume measures the number of coins traded over a specific period and confirms the strength of price moves. High volume during an upward move supports the legitimacy of a rally.
Conversely, price rises on low volume may signal weak buyer interest or a potential reversal. Volume spikes often precede or coincide with major price changes.
Comparing volume trends with price patterns helps differentiate between fake outs and genuine breakouts. It’s critical for validating signals drawn from charts.
Key Indicators and Metrics to Watch
Understanding Bitcoin price movements requires analyzing a mix of technical and on-chain data. Some indicators track price trends and momentum, while others reveal investor behavior and network activity.
Moving Averages
Moving averages smooth out price data to show trends over specific periods. The most common are the 50-day and 200-day moving averages. When the price crosses above or below these averages, it can indicate changes in momentum.
The 50-day moving average reflects short- to mid-term trends, while the 200-day moving average captures long-term trends. A bullish signal often occurs when the 50-day crosses above the 200-day, called a “golden cross.” The opposite is a “death cross,” signaling potential downward pressure.
Traders use moving averages to identify support and resistance levels. They help confirm trend direction and entry or exit points in trades. Combining short- and long-term averages yields a clearer market picture.
Relative Strength Index (RSI)
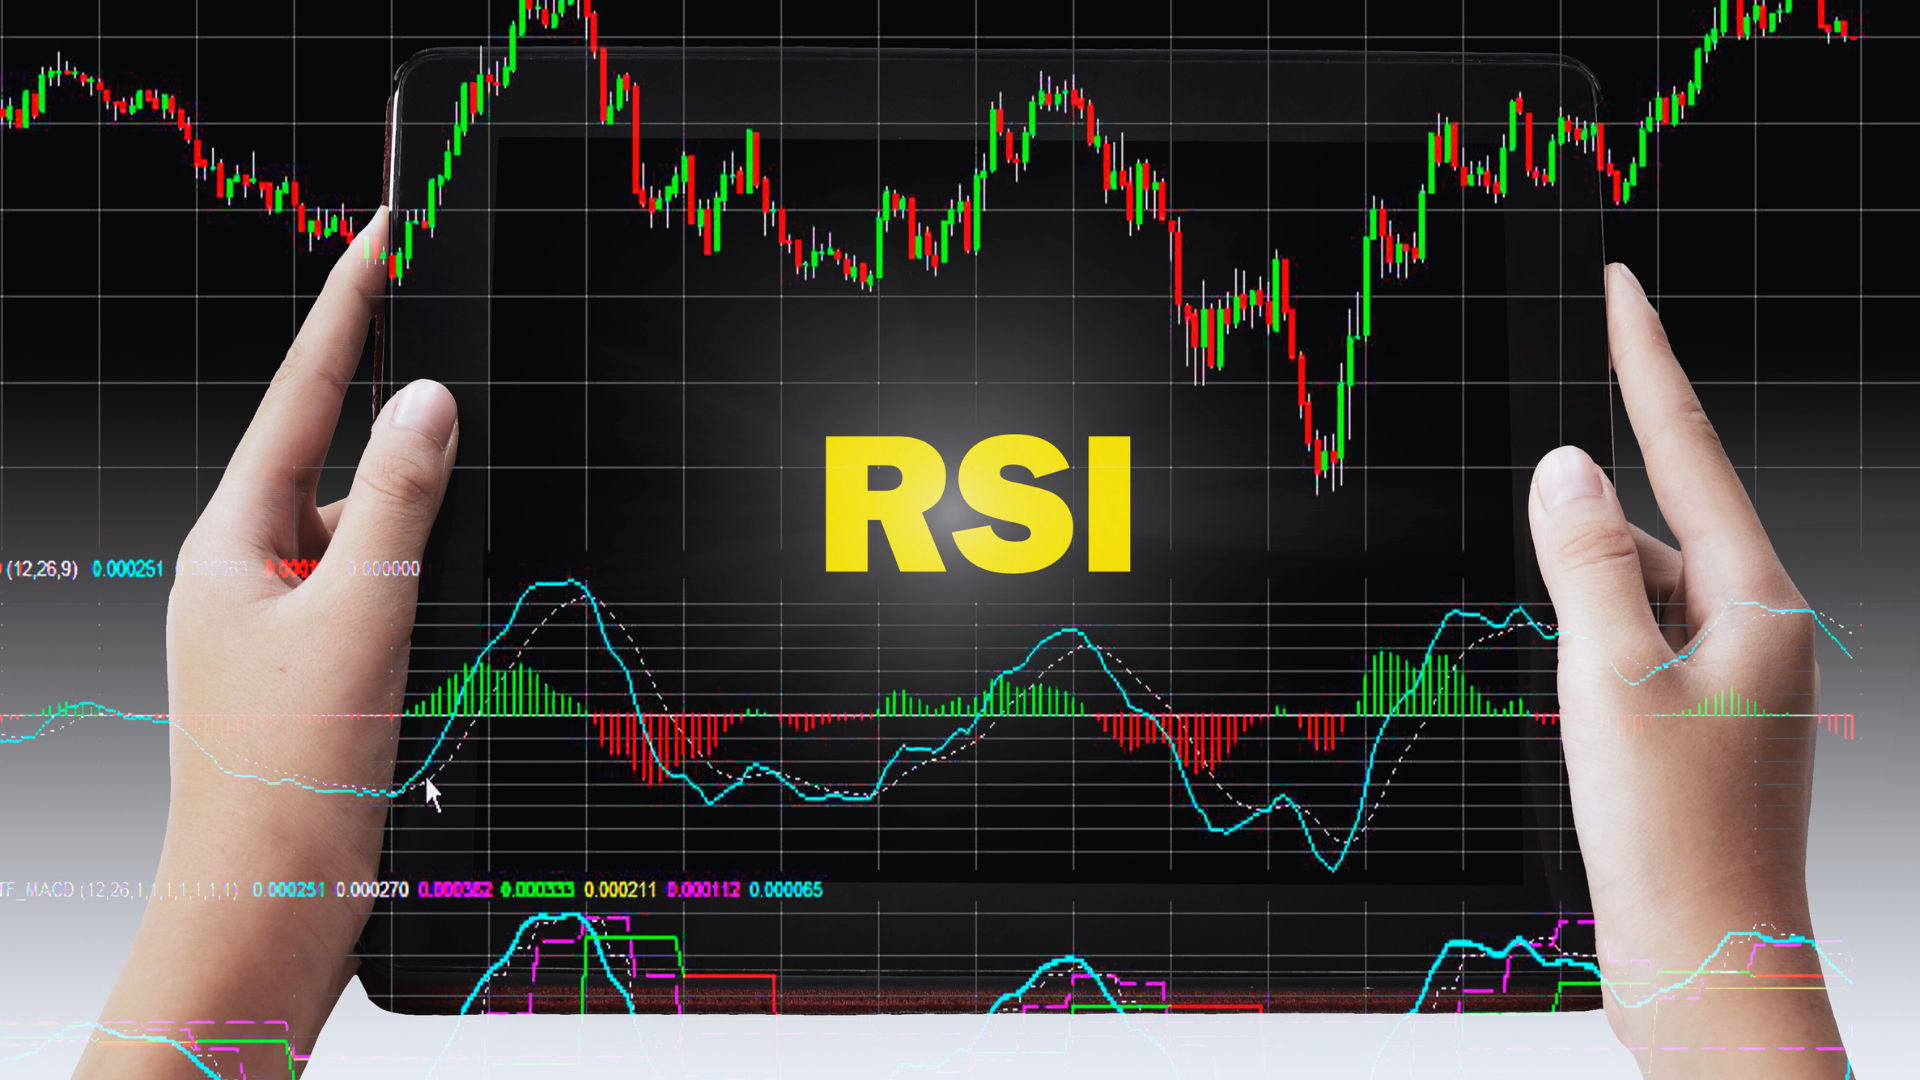
The RSI measures price momentum on a scale from 0 to 100. It indicates whether Bitcoin is overbought or oversold. Readings above 70 suggest the asset may be overbought and due for a pullback. Readings below 30 indicate it may be oversold and ripe for a bounce.
RSI values near extremes show potential reversal points or trend weakness. It’s particularly useful during sideways or choppy markets. Traders often look for divergence between RSI and price—when price moves in one direction, but RSI moves oppositely—as a warning sign.
The indicator is calculated over 14 periods by default, but can be adjusted. It works best combined with other tools for confirmation, rather than as a standalone signal.
On-Chain Data
On-chain data reveals Bitcoin network activity directly from the blockchain. Metrics like transaction volume, active addresses, and hash rate provide insight into demand and security.
High transaction volume can indicate increased buying or selling pressure. Rising active addresses often reflect growing user engagement. The hash rate measures mining power; a strong hash rate suggests network health and miner confidence.
Other useful on-chain signals include coin age spent and UTXO analysis, which help estimate holder behavior and potential price moves. On-chain data complements price analysis by showing underlying fundamentals. Tracking these metrics helps anticipate trend shifts tied to network activity.
The Impact of News and Global Events
News and global events can trigger rapid changes in Bitcoin’s price by affecting investor sentiment and market liquidity. The speed and nature of information dissemination often dictate the scale and duration of price reactions.
Media Coverage
Media coverage shapes public perception of Bitcoin. Positive reports—such as institutional adoption or regulatory clarity—tend to boost demand, pushing prices up. Conversely, negative headlines, including government bans or security breaches, often cause sharp sell-offs.
The timing and tone of coverage matter. Breaking news can lead to immediate spikes or drops, as traders react quickly. Repeated exposure to certain narratives may reinforce market trends over days or weeks.
Social media platforms amplify this effect by spreading information faster and to a wider audience. Viral posts or influential endorsements can drive speculative trading, increasing volatility.
Market Announcements
Market announcements include regulatory updates, corporate decisions, and technological developments affecting Bitcoin. For example, a country approving Bitcoin as legal tender usually leads to a positive price response.
Announcements from major exchanges or investment firms, like adding Bitcoin trading pairs or launching new financial products, can increase liquidity and accessibility, often raising prices.
Technical upgrades, such as network improvements or forks, impact price by affecting network security and usability. Announcements signaling potential challenges or delays may depress prices.
Market participants closely monitor these events, adjusting positions quickly. The predictable timing of some announcements makes them focal points for strategic trading.
Common Mistakes When Analyzing Bitcoin Price
A frequent error is relying solely on short-term price changes. Bitcoin’s market is volatile, and small fluctuations do not always indicate a long-term trend. Focusing only on daily or hourly moves can lead to poor investment decisions.
Another mistake is ignoring external factors such as regulatory news, macroeconomic events, or technological developments. These elements often influence Bitcoin prices but can be overlooked when analyzing charts alone.
Many analysts also fall into the trap of overusing technical indicators without context. Indicators like RSI, MACD, or moving averages provide signals, but they must be interpreted alongside market sentiment and fundamental trends. Blindly following indicators can be misleading.
Emotion-driven decisions are common; panic selling during dips or FOMO buying during rallies impacts analysis negatively. Detached, objective evaluation is crucial for understanding price movements.
| Common Mistake | Impact | How to Avoid |
| Short-term focus | Misreads market direction | Consider longer time frames |
| Ignoring external influences | Missing key factors | Track news and events concurrently |
| Overreliance on indicators | False signals | Use indicators with contextual data |
| Emotion-driven decisions | Poor timing and judgment | Stick to a clear, rational plan |
Avoiding these pitfalls improves clarity when analyzing Bitcoin’s price and helps form better strategies.
Developing an Informed Perspective
Understanding Bitcoin price movements requires integrating multiple sources of information. This includes analyzing market data, tracking news events, and considering broader economic factors.
Focus on key drivers like supply and demand, regulatory developments, and technological changes. These elements often influence price trends over short and long periods.
| Factor | Impact on Price |
| Supply Constraints | Limited Bitcoin supply drives value |
| Market Sentiment | Positive news can boost demand |
| Regulatory Actions | Can either restrict or encourage use |
| Technological Updates | Affect usability and network security |
It’s important to observe market sentiment through social media and forums. Investor emotions often cause rapid price swings.
Historical data helps identify patterns. For example, Bitcoin’s price typically reacts to halving events, which reduce the new coin supply.
Using multiple indicators—such as volume, price charts, and on-chain metrics—provides a clearer view. Avoid relying on a single factor, as this can lead to incomplete conclusions.
Developing an informed perspective takes time and consistent effort. Staying updated and questioning sources improves understanding.